
Author
IDA Pro is the most common software for reverse engineering in the industry. It can decompile the five most common architectures (x86/x64/ARM/PowerPC/MIPS), disassemble more than a hundred rare architectures, and debug most of them.
This article is a selection of my favorite tips for IDA Pro. Let’s get to it!
Data Structure Alignment
Compilers usually put structure fields at aligned offsets of 4 or 8 bytes, but this is not the case in some exotic scenarios.
Suppose the source code of the examined software has the following structure:
struct test_s {
    char ch1;
    QWORD qw1;
};
Usually, a compiler would pad the field ch1 to a length of 8 bytes, which would make the total size of the structure 16 bytes.
Suppose the compiler didn’t do this, and you are faced with a 9-byte structure to disassemble. Such a structure could be perfectly created in the Structures window (Shift+F9), but if you create it in the Local Types window (Shift+F1), the parsed result will be wrong:
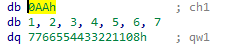
The value of qw1 will be mapped to the data after the created padding, but the actual value of qw1 is located in the created padding itself (db 1, 2, 3, …).
To correctly display the structure, you need to fix the alignment by adding the directive #pragma pack(1):
#pragma pack(1)
struct test_s
{
char ch1;
QWORD qw1;
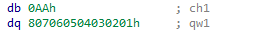
};This will result in the correct parsing of this structure:
Full-Text Search
If you’ve ever tried to use Ctrl+F in IDA Pro, you’ve probably noticed that this keyboard shortcut only works in the Imports, Exports, and Strings windows.
For all the other windows, there is the Alt+T combination.
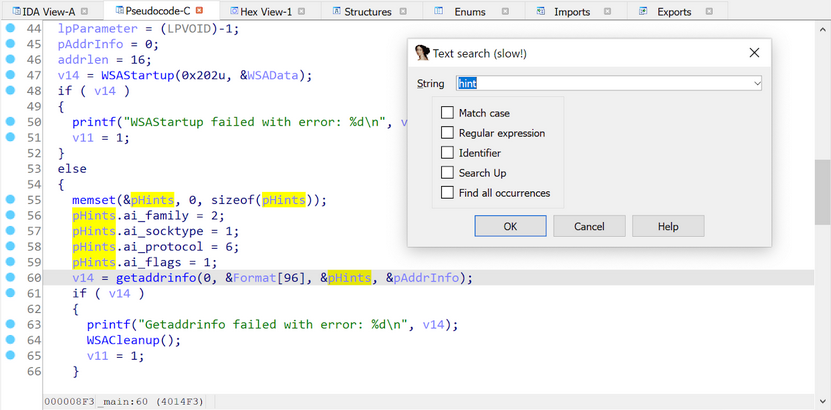
Using Alt+T, you can search information in the Disassembler, Pseudocode, and Structures windows.
Rebasing Binaries
When you open a binary file in IDA Pro, and this file is not in the well-known format (e.g. ELF or PE), IDA asks you about the address it needs to load the file. Usually, this address cannot be known before the file is examined.
Let’s load a sample firmware to the 0x0 address:
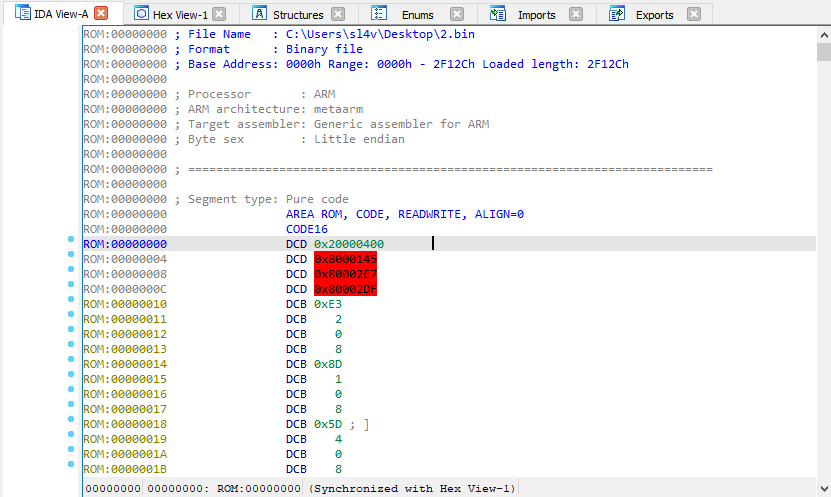
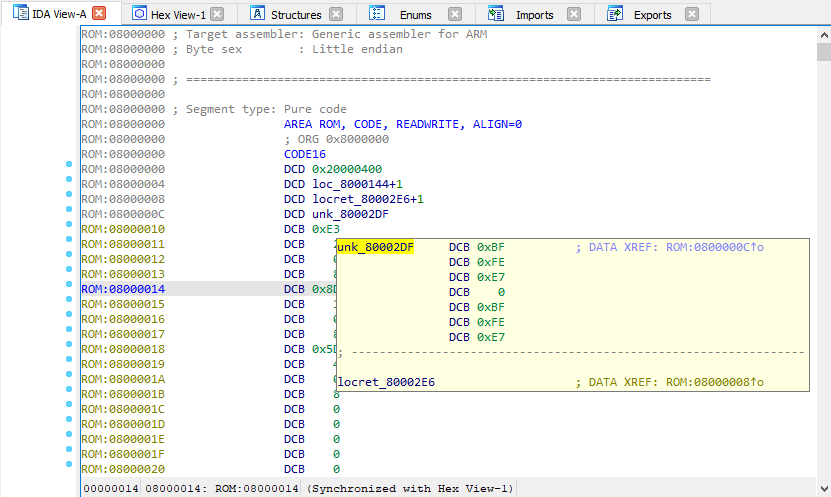
After the firmware is loaded, there are three pointers to the uninitialized memory at the 0x04 address: 0x80000145, 0x800002E7, and 0x800002DF. Therefore, you can guess that the initial offset is 0x80000000.
To avoid reloading the firmware, you should call the Rebase Program function using Edit → Segments → Rebase, and shift the firmware to the 0x8000000 address:
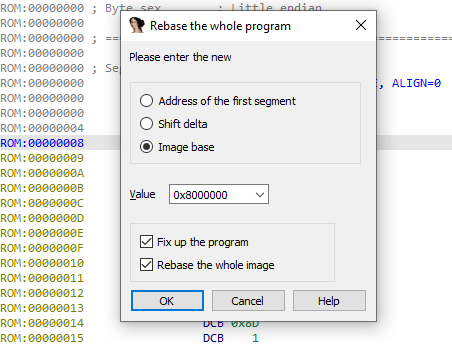
This will correctly display the firmware:
Selecting and Exporting Binary Data
There are two hotkeys that can help you export data from IDB files:
Alt+L. Selects a data region of any length
Shift+E. Exports the selected data to different formats
After you press Alt+L, IDA starts selecting data and fixes the initial selection point. This will help you move the destination selection point anywhere you want.
When the needed region is selected, press Shift+E to export the data in a supported format, such as a string, HEX sequence, or C-bytes array. After the data is copied, stop selecting by pressing Alt+L again.
These combinations work in the Disassembler and Hex-View windows.
Revealing String Literals in the Decompiler
Some old compilers, and compilers for real-time operating systems, typically place read-only and read-write data in the same segment. This leads to a situation wherein the decompiler shows variables instead of string literals where the latter are supposed to be.

The first way to fix this issue is to change the variable type from char * to const char * by the Y hotkey.

The second way is to go to the decompiler settings (Edit → Plugins → Hex-Rays Decompiler → Options); and uncheck the “Print only constant strings literals” checkbox:
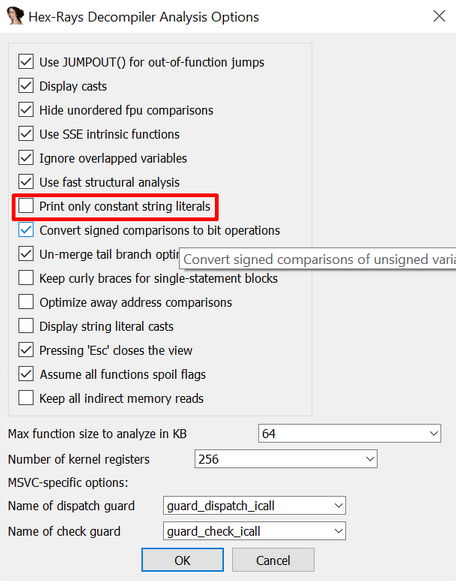
As a result, all the data-containing variables are shown as string literals:

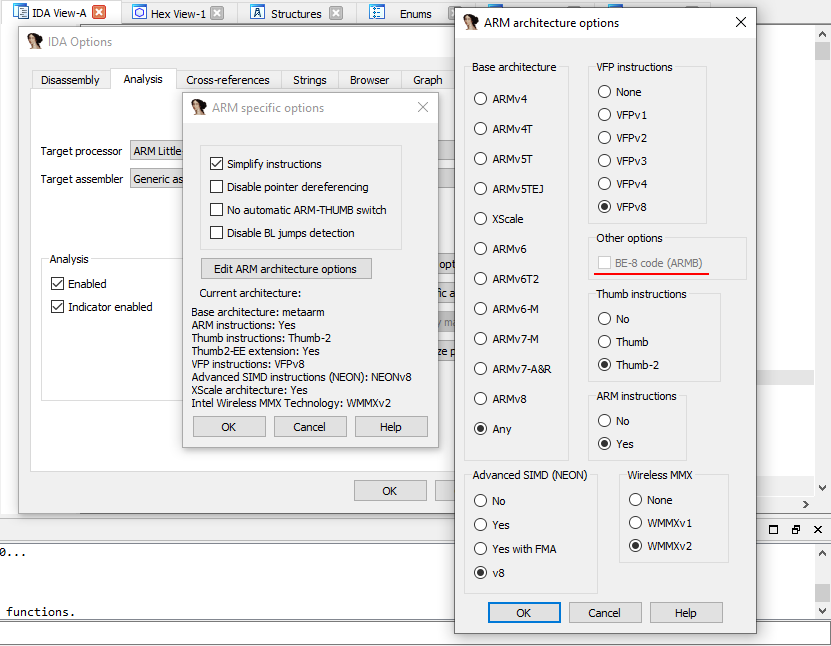
Little-Endian Code, Big-Endian Data
Some ARM compilers create Little-Endian code but make data in the Big-Endian format.
To display such binaries correctly, go to General Options → Analysis → Processor-Specific Analysis Options → Edit ARM Architecture, and check the “BE-8 code (ARMB)” checkbox:
Breakpoints: Setting Conditionals
IDA Pro supports conditional breakpoints, which consist of a code in IDC/Python that is run in a specific location.
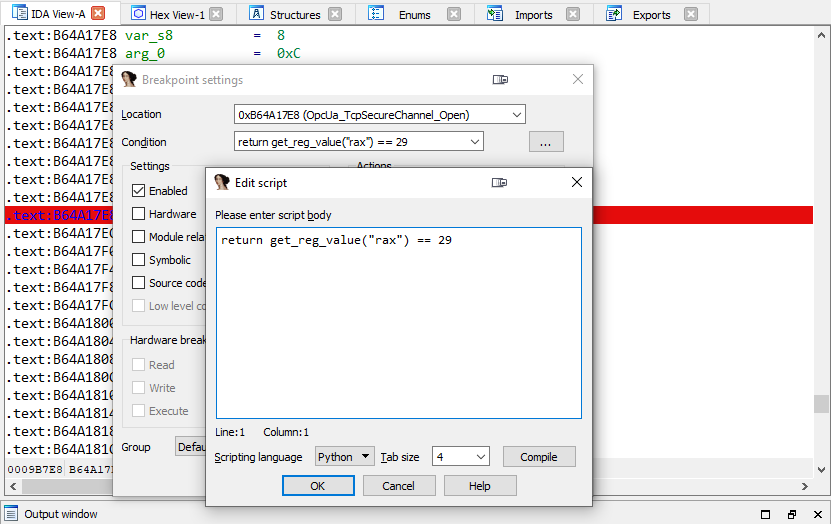
Note that an IDC/Python code can be run during a debugging to modify the register values and the memory data as well.
Breakpoints: Disabling Stepping Support
When I debug binaries via a GDB server in IDA Pro, I often encounter a bug in which breakpoints stop working after one of the breakpoints has been successfully triggered.
In this case, I go to Debugger → Debugger Options → Set Specific Options, and I uncheck the “Use stepping support” checkbox:
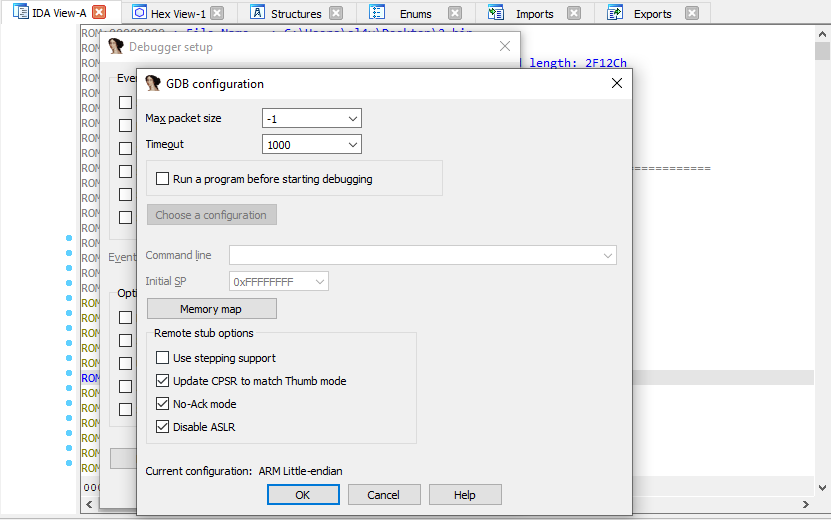
After the stepping support is disabled, the breakpoints start functioning properly.
This configuration isn’t saved to IDB files. To keep it disabled, add the SINGLE_STEP = 0 line to the %IDADIR%\cfg\dbg_gdb.cfg configuration file.
Remote Debugging: IDA Debugging Servers
IDA Pro has its own remote debugging servers for Windows, Linux, Mac, and Android. They could be used instead of ordinary GDB or WinGDB servers.
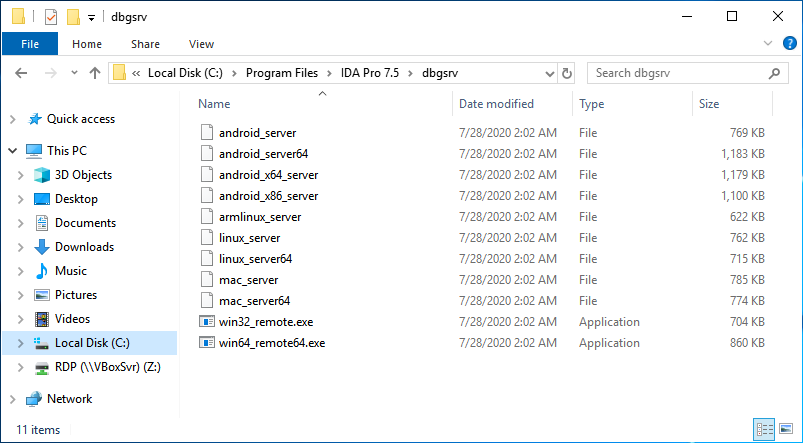
These files are located in the %IDADIR%\dbgsrv directory.
Remote Debugging: ASLR
If you attach to a remote GDB server on a system that has ASLR, IDA Pro will not be able to find the location of the examining binary in the memory. As a result, IDA Pro will try to work with addresses pointing to an invalid memory space.
To make IDA Pro use the real binary addresses, rebase the IDB before attaching to the target process.
Garbage Collection in IDAPython
IDA Pro’s built-in Python interpreter constantly runs in the IDA background and never restarts. Therefore, all the variables and objects you create in the code accumulate, and this could lead to memory leaks and unexpected side effects.
For example, let’s create a file test.py with the following code:
import logging

def main():
    logger = logging.getLogger('test1-script')
    logger.setLevel(logging.DEBUG)
    formatter = logging.Formatter('[TEST 1] %(name)s - %(message)s')
    ch = logging.StreamHandler()
    ch.setFormatter(formatter)
    logger.addHandler(ch)
    logger.debug("Log message!")

if __name__ == "__main__":
    main()
After you run this file twice, you will see that two logging handlers start to work simultaneously:
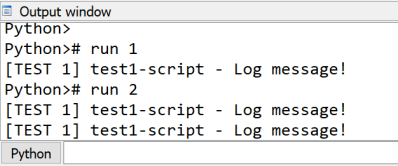
So, you need to pay close attention to the code to prevent such unwanted behavior.
In the case of the logging class, I recommend you use one of following ways to clear the handlers:
# Python 2/3
logging.Logger.manager.loggerDict.clear()

# Python 3
from importlib import reload
reload(logging)

# Python 2
reload(logging)
IDA Pro 7.4+ Tips
Collapsing local variable setting
The local variables could be collapsed by default if you set the COLLAPSE_LVARS parameter to YES in the %IDADIR%\cfg\hexrays.cfg file.
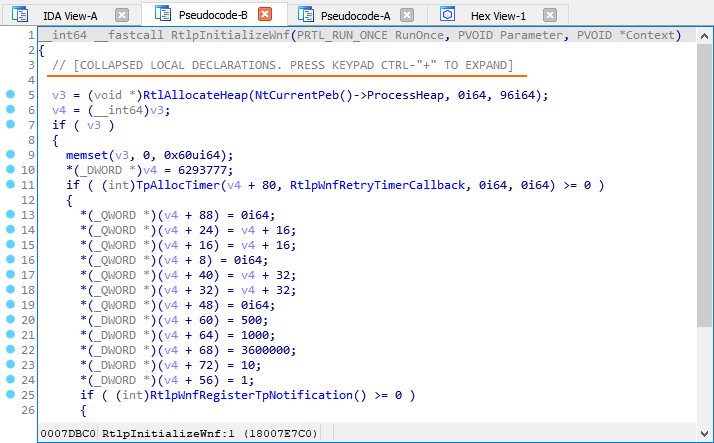
This used to be possible through the Numpad+- shortcut or by the Collapse Declarations option in the context menu.
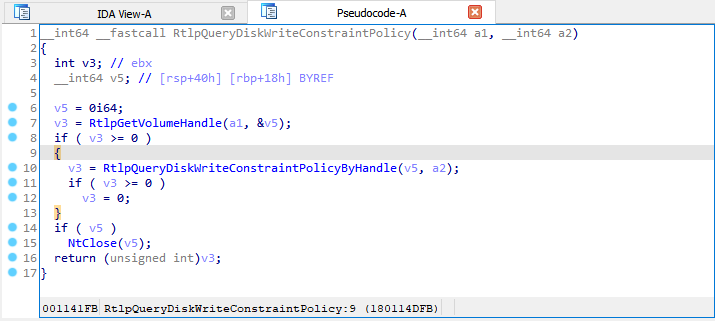
Jumping between matching parentheses/brackets
Matching parentheses/brackets are now highlighted in the pseudocode, and you can quickly jump between them by the % key (Shift+5).
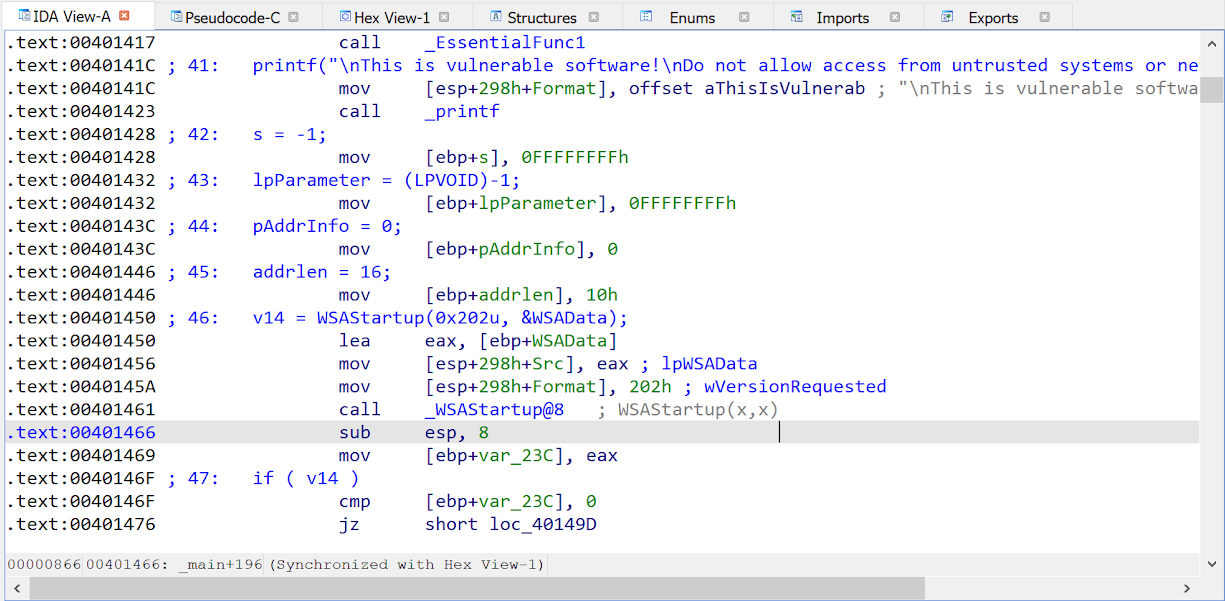
Copying the pseudocode to the disassembly listing
The / hotkey can copy the pseudocode to the disassembly listing as comments.
More Tips and Tricks
If you’re running out of tricks and tips for IDA Pro, check out the following sources. You’ll definitely find what you specifically need.
Share your favorite tricks in the comments on our Twitter!