
Author
Have you ever wanted to find out how a program you often use, a game you play a lot, or the firmware of some realtime device actually works? If so, what you need is a disassembler. Better still, a decompiler. While things are pretty clear with x86–x64, Java, and Python, as there are plenty of disassemblers and decompilers to go around, with other languages, the situation is a little bit more complicated, and search engines will simply tell you ‘it can’t be done.’
Well, we decided to challenge this assertion and decompile NodeJS. More specifically, the bytenode npm package spin-off. This is actually the second article in the series about our Ghidra plugin. Here we go.
Part zero: jumping ahead
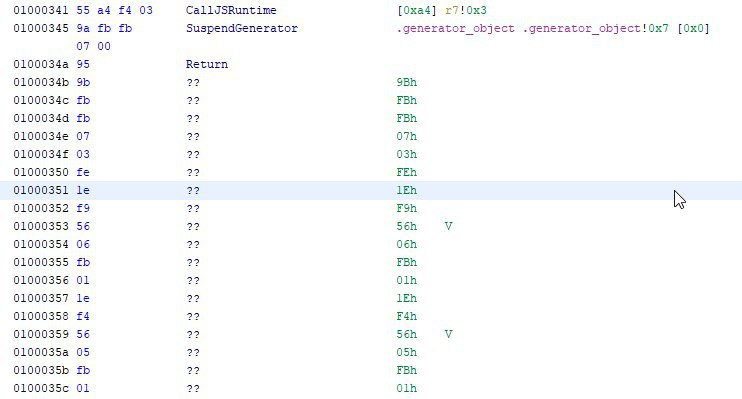
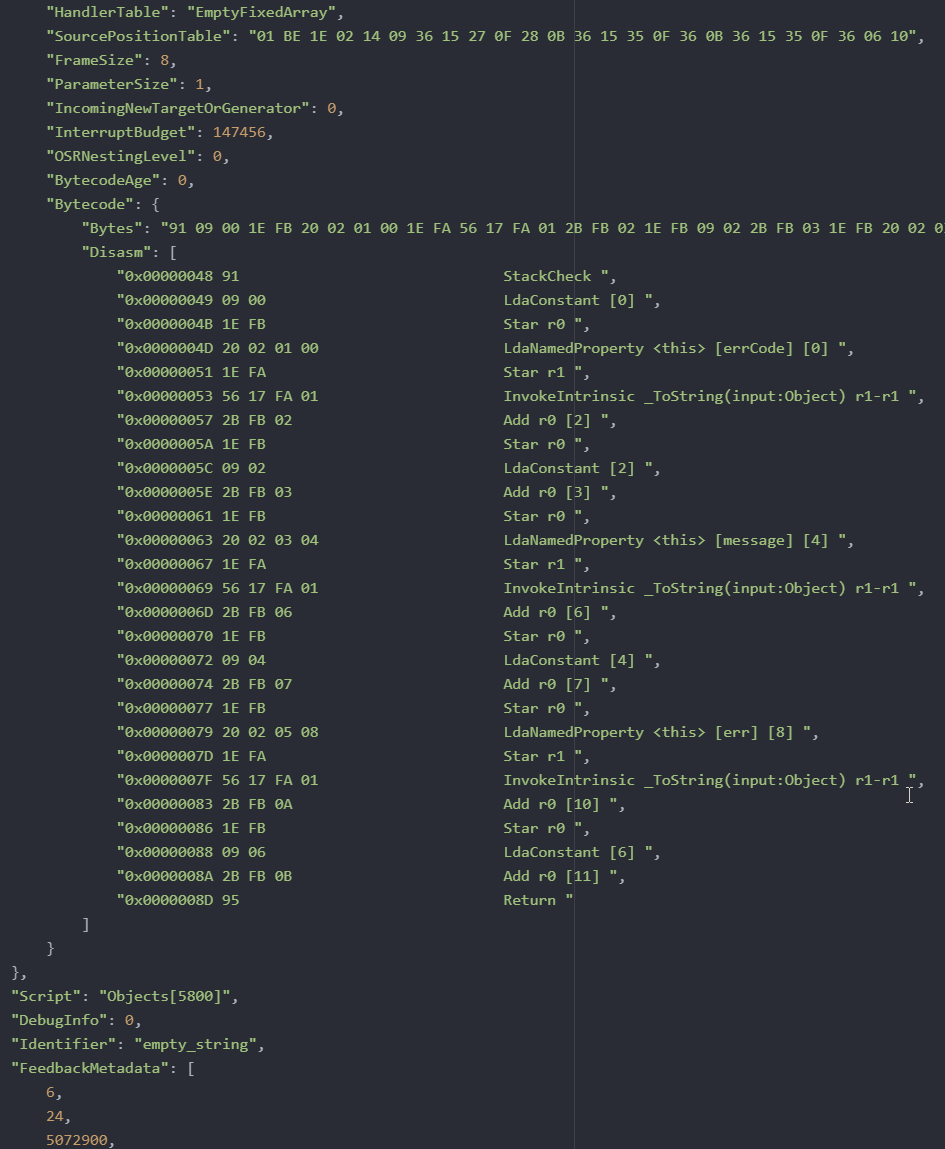
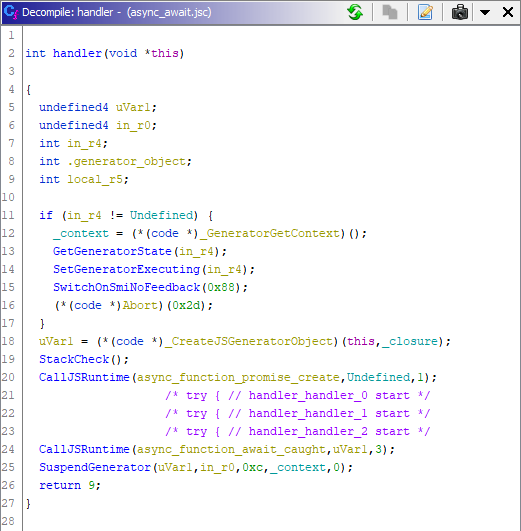
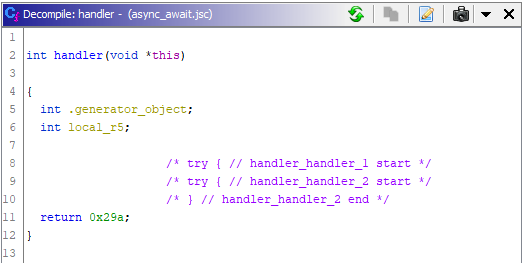
Yes, we really did manage to decompile NodeJS in Ghidra, transforming this code:
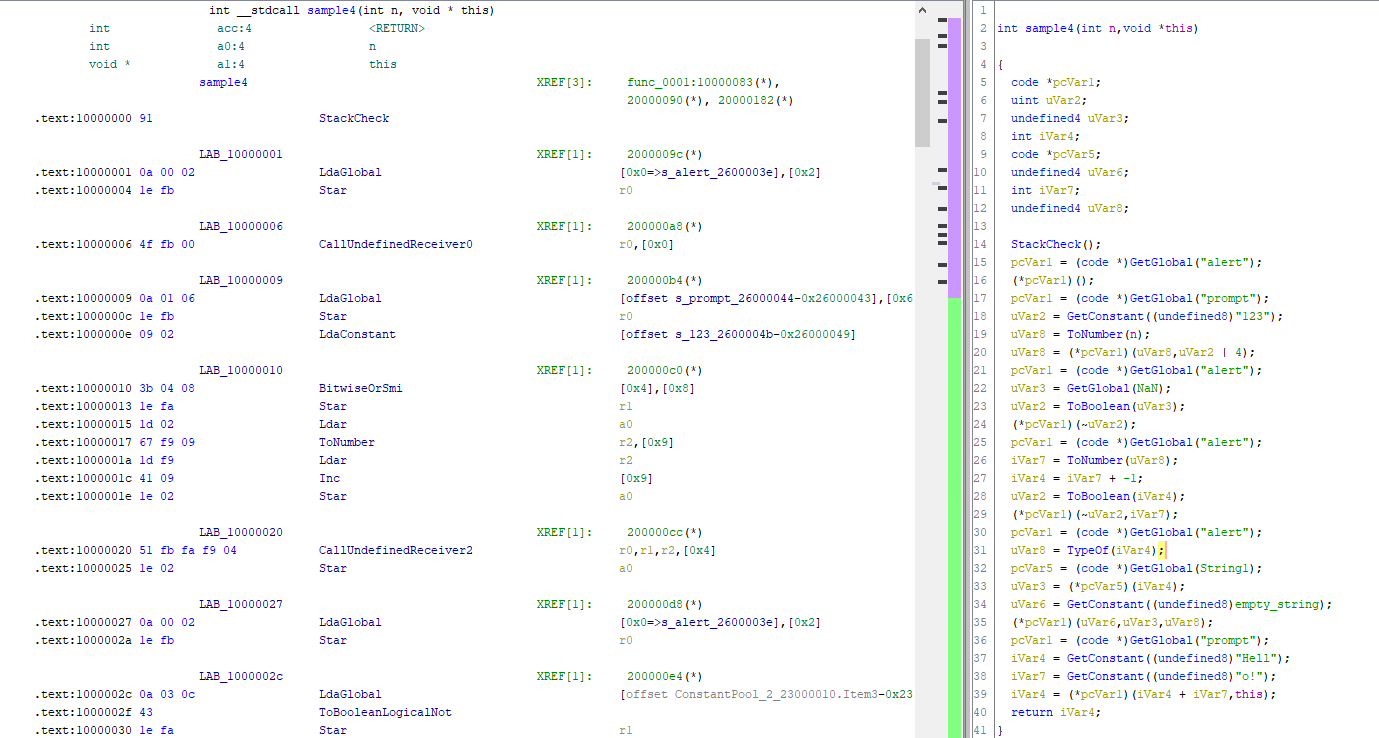
To this one:
In the end, we are delighted to present you with our Ghidra plugin, which has the following capabilities:
- Parsing bytenode output. In addition to the code being run, it also parses the constant pool, function arguments, visibility fields, exception processors, and context variables.
- A fully-fledged disassembler of JSC files in Ghidra, displaying all of the required data for reverse engineering the file in question.
- Support for all opcodes, including opcodes of varying length: wide and extra-wide.
- Analysis of standard library function calls (
IntrinsicandRuntimecalls). - All cross-references are analyzed, even in obfuscated code, which facilitates the analysis of any NodeJS application.
Naturally, there are a number of limitations, too. We’ll cover them at the end of the article.
What’s in the plugin
- Loader: parses the file, creates the necessary sections for the code and the constants. This is suited for those who prefer a disassembler over a decompiler.
- Analyzer: applied after the loader. Arranges the cross-references, removes stub code that the compiler has generated (simplifies analysis), and tracks codeflow.
- A disassembler that also doubles up as a decompiler. Thanks to the technologies implemented in Ghidra, when you write the disassembler, you get a decompiler at the same time, which is really convenient. To do this, Ghidra’s internal language SLEIGH is used.
- The last part of the module is the constructor injector in PCode (intermediate representation language in Ghidra, similar to IDA microcode). The injector draws up an intermediate representation for the decompiler when this is hard to achieve or even impossible using SLEIGH.
Creation process
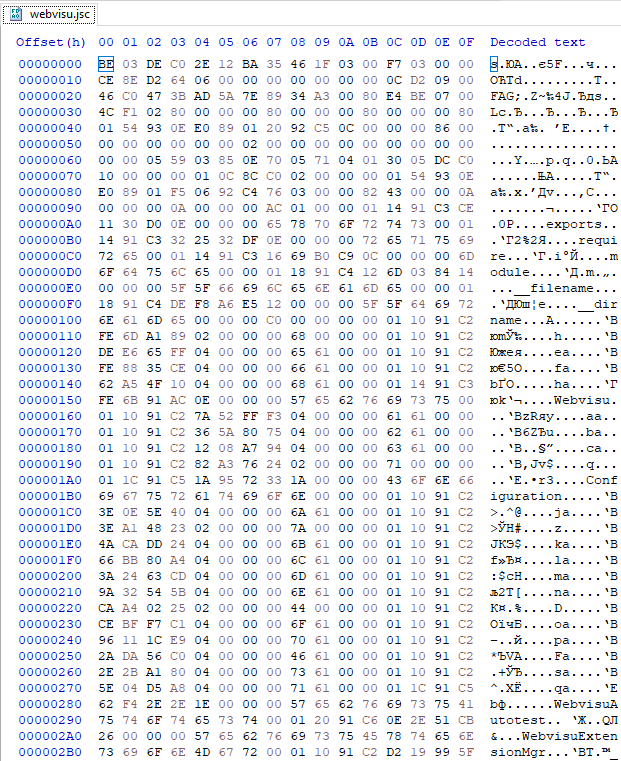
As is usually the case, when you deal with all kinds of weird reverse engineering, ‘it was just another-binary-to-analyze project.’ In our case, it came with the .jsc extension and was launched using node.exe. Googling this string led to bytenode, a package for Node.js that converts source code in JavaScript to a JSC file with v8 bytecode, which is guaranteed to run on the same Node.js version it was built with, with the prerequisite being that bytenode is installed.
The binary is akin to .pyc or .class files where the interpreter runs the file built for it, in precisely the same way. The only problem is that for the first and the second format, there are already lots of various file-sharing sites decompilers, but there aren’t any for Node.js bytecode.
But hold on, you say, Node.js already has a built-in disassembler and you can use it to view what is going on in the file. That is indeed the case. However, it is based on the understanding that you have the source code available, but we didn’t. Therefore, with a determined effort, we decided to write this damned decompiler! Would we have taken this project on had we known what we’d be put through? Yeah, of course we would!
Immersion and compilation of Node.js
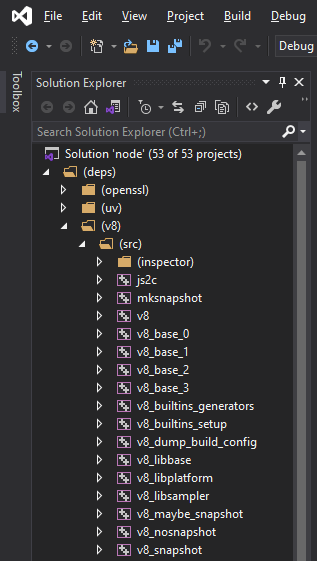
Okay, so what do we need to start our analysis of the format? The theory, which tells us about the fundamental internals of Node.js? Who even does that? Incidentally, this theory is beautifully set out in the article following the link. We need Node source files! Additionally, their version has to coincide with the version of Node.js used for building the JSC file. Otherwise, it won’t work.
Having cloned the repository and having tried to compile it, we encountered the first difficulties: the thing wouldn’t compile. Of course, given the dimensions of the repository and its cross-platform support, we shouldn’t have been surprised. Moreover, at the time of writing, support had appeared not that long ago for the latest version of Visual Studio 2019 in the Node.js build system. Therefore, to build v8.16 that we actually need, we have to clone both branches: the current branch and the one we need, and then compare their build systems.
The build system consists of Python scripts, .bat and .sln projects. Python scripts generate projects for Visual Studio, set defines, and then Studio builds it all. That’s right, it builds it. However, it somehow only works in the Release build config, not in Debug. For our purposes, though, we specifically needed the Debug config.
During our debacle with Studio, which took place over several days, we discovered that the preprocessor flags were at fault; for some reason, they disrupted the work of the interpreter specifically during any interaction with bytenode. But no matter; we corrected the flags in all ≈10 projects for all build variations and the Debug Node.js was successfully built.
Now we can use it successfully to debug the source code of Node.js itself. In addition, new tracer flags appear when run, which help us understand even more clearly what is happening when running the code.
Format parsing
A huge quantity of breakpoints was set everywhere where, in principle, the JSC file parsing could commence, and the debugging was finally launched.
Some of the installed breakpoints started responding even before the parsing of the JSC file even began, which tells us that Node.js itself uses this format inside the interpreter. In the end, the turn of our file came around.
And things kicked off.
It is well known that that a huge number of macros are used in major projects in C++. Without doubt, they help when writing code to reduce the size of large and repeating sections, but they are no use at all during debugging, rather they seriously complicate and protract the process, especially if you have to find where things are defined or assigned, and they are defined or assigned in a macro that consists of about 20 lines.
Nevertheless, with each new session of line-by-line debugging, our understanding was continually expanded until we actually managed to write our own parser in Python, which successfully parsed through all serialized data.
Of course, JSON navigation (more on this a little later) was such a jolly little task, that an important decision was made, which had a serious impact on our ongoing analysis, which was to switch to Ghidra. This decision gave rise to the following problems that we had to address:
- Porting the parser from Python to Java and writing a JSC format loader
- Creating a new processor module which will help disassemble V8 (this is the engine used in Node.js)
- Implementing the logic of the V8 opcodes to obtain a decompiled listing
Loader for Ghidra No. 1
The first loader was a simple affair: it broke down JSON, which was generated by the Python version of the parser, it created all of the sections and the objects and loaded the bytecode. While one part of the team wrote the disassembler, the other part ran the opcodes in SLEIGH, creating the concept of a plugin for Ghidra in parallel. In this way, up until the time this variation of the loader was prepared, the entire team was able to work in parallel.
While we were happy with this variant, we still didn’t want to do a public release: it wasn’t usable, convenient, or anything like that… Therefore, we set about writing loader No. 2.
Loader for Ghidra No. 2
This was the option that we ended up with. As already mentioned, it can load and parse the JSC format directly, create structures, generate cross-references, and analyze everything that Ghidra needs and how it needs it. We altogether liked this variant more, as it had greater potential right from the start. The only thing was that a loader of this kind took so much longer to write. That said, the result is worth it.
We have covered the introductory elements; now we can get down to the real nightmare. The first thing we encounter is the loader.
Inside the loader
The loader is essentially engaged in preparatory work for all the other components of the plugin, and there is a lot that it needs to do:
- Parse the JSC file into structures that will then be used by the disassembler, analyzer, and decompiler.
- Display to the plugin user all the structures that will be needed during reverse engineering: the code, line numbers, integers, contexts, and exception processors.
- Rename all objects, which have a name and which do not (regular code, appearing in brackets).
- Identify built-in functions of Node.js, which are identified exclusively by indices.
At this stage, we had to create many Java classes (structures) in the plugin code, each for their own data type, so as not to get totally confused. In all probability, the greatest amount of time was spent on this part of the code.
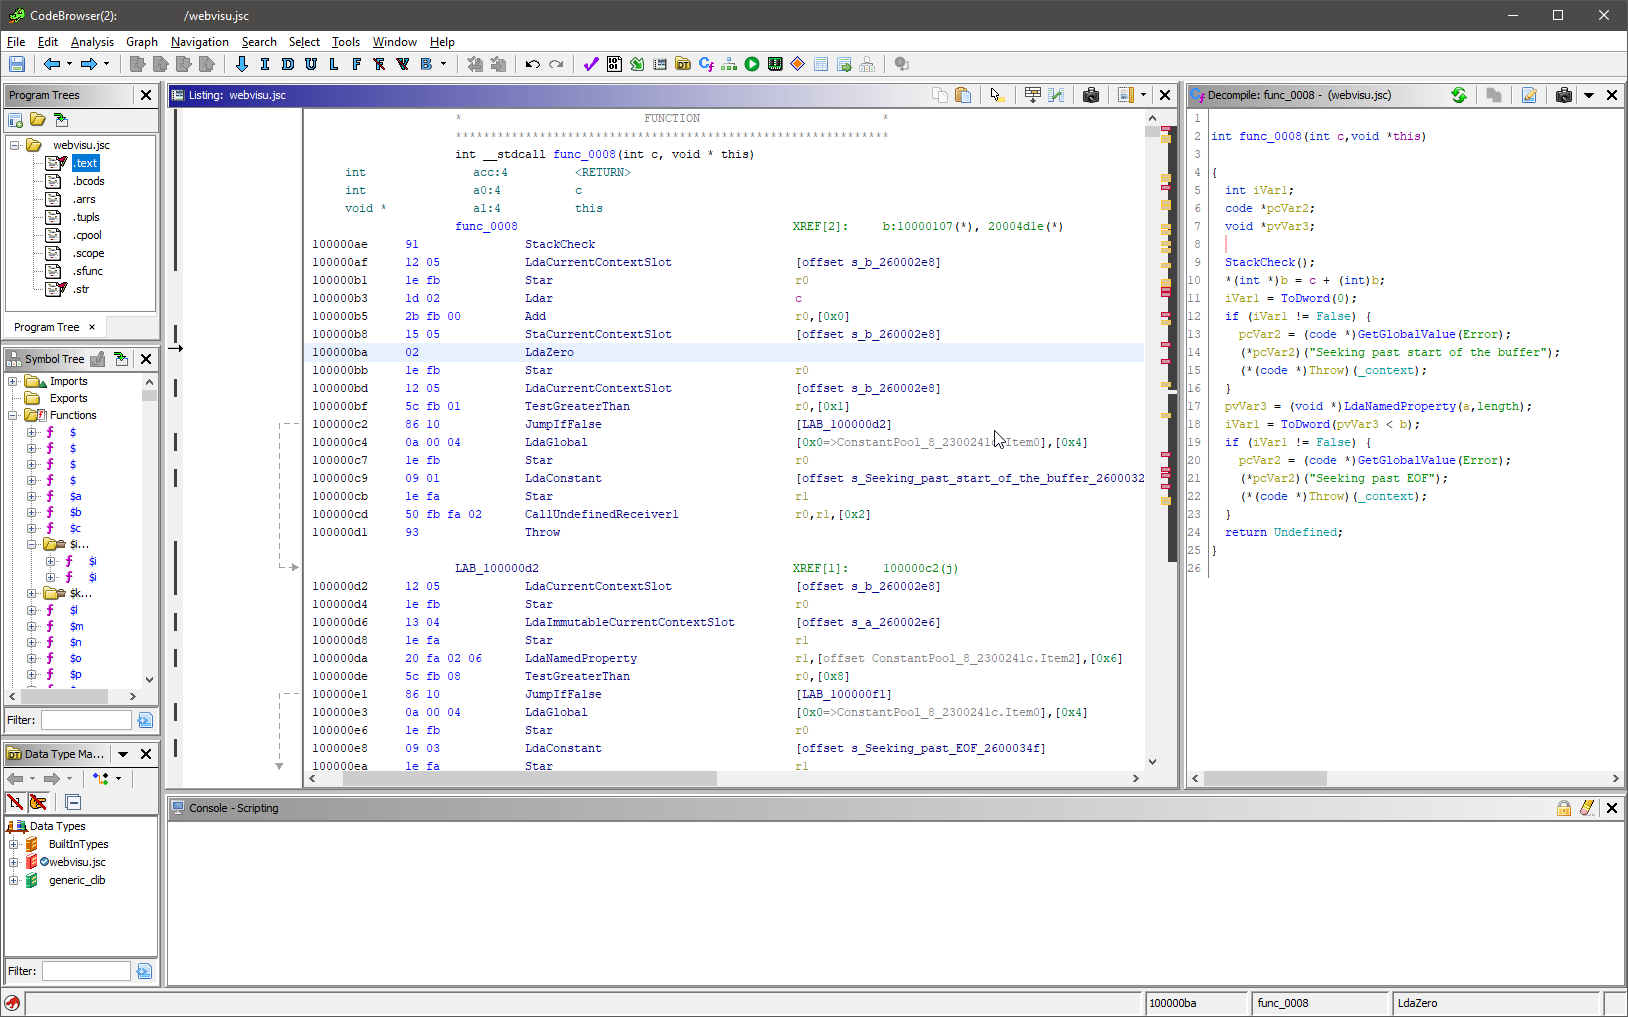
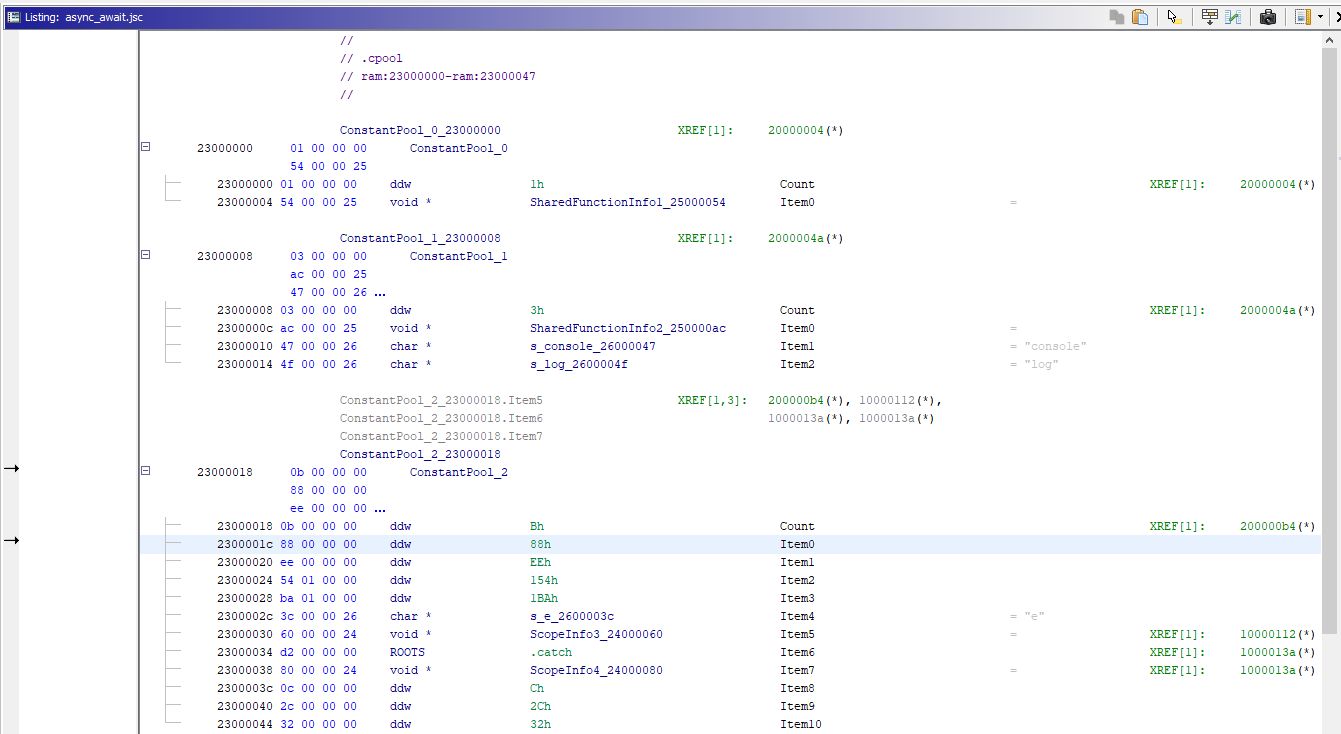
When loaded in Ghidra, the file usually looks something like this:
What’s in the image
- Segments can be seen in the top left. They are not in the JSC format, but we had to create them in order to group together similar data types and separate them from the code.
- To the left is a list of functions. With the file you see in the screenshot above, they are all obfuscated, so they have identical names. However, this in no way hampers the plugin from correctly analysing the cross-references.
- We can see the disassembler listing in the center of the screenshot. In any event, you will have to work with it as the decompiler, alas, is not all-powerful.
- On the right is a decompiled C-like listing. As we can see, it considerably simplifies the analysis of the JSC application.
Disassembler
For the entire loaded set of bytes to become code, it essentially has to be disassembled. When creating the plugin using the special language (SLEIGH), you are actually describing the procedure by which certain bytes are transformed into certain instructions.
As far as the quirks of writing the processor module go, we can note the following:
- V8 bytecode is interpretable, which complicates the implementation process. Nevertheless, in many aspects, the source code of other processor modules, such as that of the Java virtual machine, was of considerable assistance.
- When working with certain register types (for example, local variable registers can be used with an index from
0to0x7FFFFFFF-4), a compromise was necessary in the form of a maximum limit of registers displayed in the disassembler.
Analyzer
The second largest part of the plugin after the loader is probably the analyzer. Its main task is to organize the results of the loader. That implies the following:
- Creating cross-references to code and data (constant pool)
- Tracing program codeflow
- Simplifying the presentation of asynchronous code
- Accumulating information for the decompiler
Creation of links and working with the constant pool
If you have been reverse-engineering Java classes, you probably know that the constant pool is the most important object in each class. In short, it’s a bit like a dictionary with arbitrary data and references being used as keys according to specific indicies. For example, such data could be:
- Lines, numbers, lists, tuples, and other primitives
- Functions, visibility fields, and other code elements
Already having allocated objects and having created a disassembler listing, the analyzer parses each instruction and, depending on the opcode, decides what to do.
The following categories of instruction types are of interest to the analyzer:
- Interact with the constant pool.
- Depend on or alter the codeflow.
- Perform runtime functions (built-in).
The code for working with the first type of instructions is fairly voluminous, as pretty much everything can be stored in the constant pool. And references have to be added for everything. However, we would like to focus on only one of these complicated instances: SwitchOnSmiNoFeedback.
SwitchOnSmiNoFeedback
According to the name, it could seem that these are regular switches, only for V8, when in reality they’re a special construct for working with asynchronous code, that’s marked with the key words await/async. It works like this:
- The
SwitchOnSmiNoFeedbackspecifies two indices: the first is the initial index in the constant pool, where the function references are found; the second is the number of these functions. - The functions themselves take the form of an autogenerated prolog (body, epilog) for the code, which needs to be run asynchronously (a wrapper is made in the form of a context switch, it is saved and downloaded). In our plugin, this template code is replaced by a No Operation (NOP) instruction.
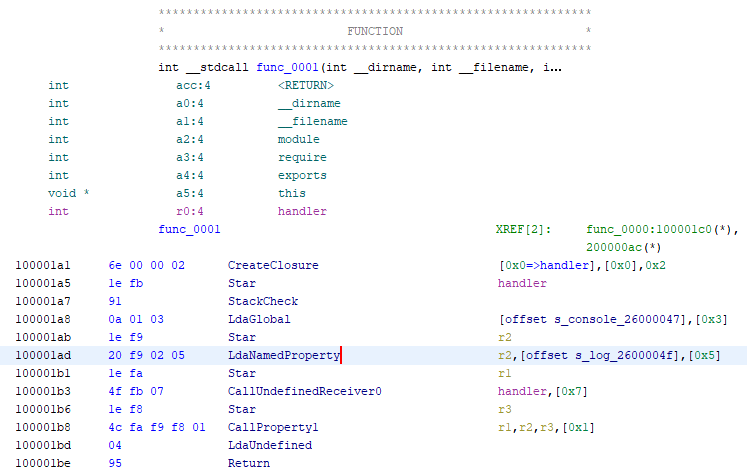
Let’s take the following code as an example:
async function handler() {
    try {
        const a = await 9;
        const b = await 10;
        const c = await 11;
        let d = await 12;
    } catch (e) {
        return 123;
    }
    return 666;
}

console.log(handler());
Context analyzer
The most complicated part turned out to be tracing codeflow. The thing is that there are visibility fields of variables (constants or code) in V8, just like in other programming languages. Usually, such syntax elements as curly brackets, indents, and colons are used to separate them. But what do you do with code that is run by an interpreter?
In the case of V8, three special entities were introduced:
- Context register
- Depth value for reference’s context
- Saving context in a context stack (downloading from it)
The context register is both common for functions and can be created locally for any section of code, such as for exceptions. This register stores a conventional link to a list of variables, available at the given moment (with their names and modifiers), along with a link to the previously available context, which gives us a tree of visibility fields that we can traverse. In addition, the value of the context register can be saved in other registers and taken from other registers.
The depth of a reference’s context is not that complicated if we get to the bottom of how to work with it. The depth is set as an operand and it specifies how many levels up we need to go in the context to retrieve a given variable.
Runtime functions
The main thing to point out here is the removal of NOP from the listing of references to functions, likewise associated with SwitchOnSmiNoFeedback, specifically referring to async_function_promise_release, async_function_promise_create, promise_resolve. In other words, the plugin simply increases the readability of the decompiler listing.
References
GitHub: github.com/PositiveTechnologies/ghidra_nodejs
Releases: github.com/PositiveTechnologies/ghidra_nodejs/releases
Previous article: How we bypassed bytenode and decompiled Node.js bytecode in Ghidra
Disadvantages
Of course, there are disadvantages. Some disadvantages are because of Ghidra’s limitations while others are a consequence of the project being implemented for a specific task (which it handled well) and the fact that there was no large-scale, full-format testing on hundreds of samples.
Release
Despite the fact that we had absolutely no plans to publish (the project had ended, reports had been submitted, and the deadlines had passed), the energy that we had invested into this project motivated us to share our plugin with the world. It is scalable to other versions and it works well with the files that we opened in it. Overall, its code, too, has been written pretty intelligently (in our opinion).
It also follows from the above that we will make improvements to the plugin only when it is used on our projects. The rest of the time only serious bugs that would lead to the complete inoperability of the plugin will be fixed. That said, we would be delighted to recieve your pull requests.
And finally, as the author of this article and the co-author of the plugin, I would like to express my considerable thanks to Sergey Fedonin, Vyacheslav Moskvin, and Natalya Tlyapova for this super project.